Content Marketing
Infographics have established themselves on the web as a tried and tested means of illustrating facts and figures on the one hand and generating website traffic on the other. A good infographic is a linkbait, a lure that encourages others to link to articles and graphics or share them on social networks. This creates important backlinks and social signals for the search engine ranking. The better and more relevant an infographic is, the higher the response. Google also notices this and naturally rewards it in the search rankings.
Example 1: The Internet as an ocean
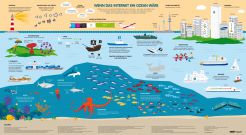
In the following infographic, the WebMagazin has attempted to depict the Internet as an ocean. The graphic is of course incomplete and does not represent an objective view. However, it is certainly good for getting an overview and, above all, for seeing certain proportions in relation to one another. Due to its simplicity, it appeals to a very large target group, and it has also been published in German and English.

Infographic: "If the internet were an ocean"
Example 2: The Internet as a subway map
The web trend maps from Information Architects are more complex. But the approach is actually the same. There are now five versions of the Web Trend Map. I like version no. 3 best, which is why it has been hanging in our agency for a long time. It shows the 300 most important and influential websites (in 2008) like on a subway map. There are various. Lines, such as the News Line or the Tech Line.

Infographic: Web Trend Map No. 3
Interactive infographics, video clips and slide presentations
A classic infographic is a large image - like a poster. However, it is also possible to prepare the content in the form of an animated, illustrated video clip or in the form of a slide presentation. Furthermore, an infographic on the Internet can of course also be interactive.
The website Visual.ly is an almost inexhaustible source of inspiration for infographics. Visual.ly specializes in creating infographics for companies and organizations from large amounts of data, which are then published on the Internet and (ideally also virally) shared.
Here are three examples:
Infographic: The Evolution of Digital Advertising
Video clip: The Economy of Coca-Cola
Interactive infographic: Nissan Innovations Timeline
Design infographics: make them yourself or commission them
There are now several online tools for creating infographics yourself. The following websites (infogr.am, piktochart.com, Google Databoard, easel.ly) promise good results even if you are not a designer. We remain skeptical about this - but we haven't tested the offers either. In any case, we are happy to design and illustrate infographics for anyone who doesn't want to do it themselves: contact us, we will be happy to advise you.

